Use case 1In development
Video camera analysis
Bring footage from traffic and street cameras into a dataflow. Computer vision nodes turn what each camera sees into data, which you can map, chart and compare with the city's other datasets.
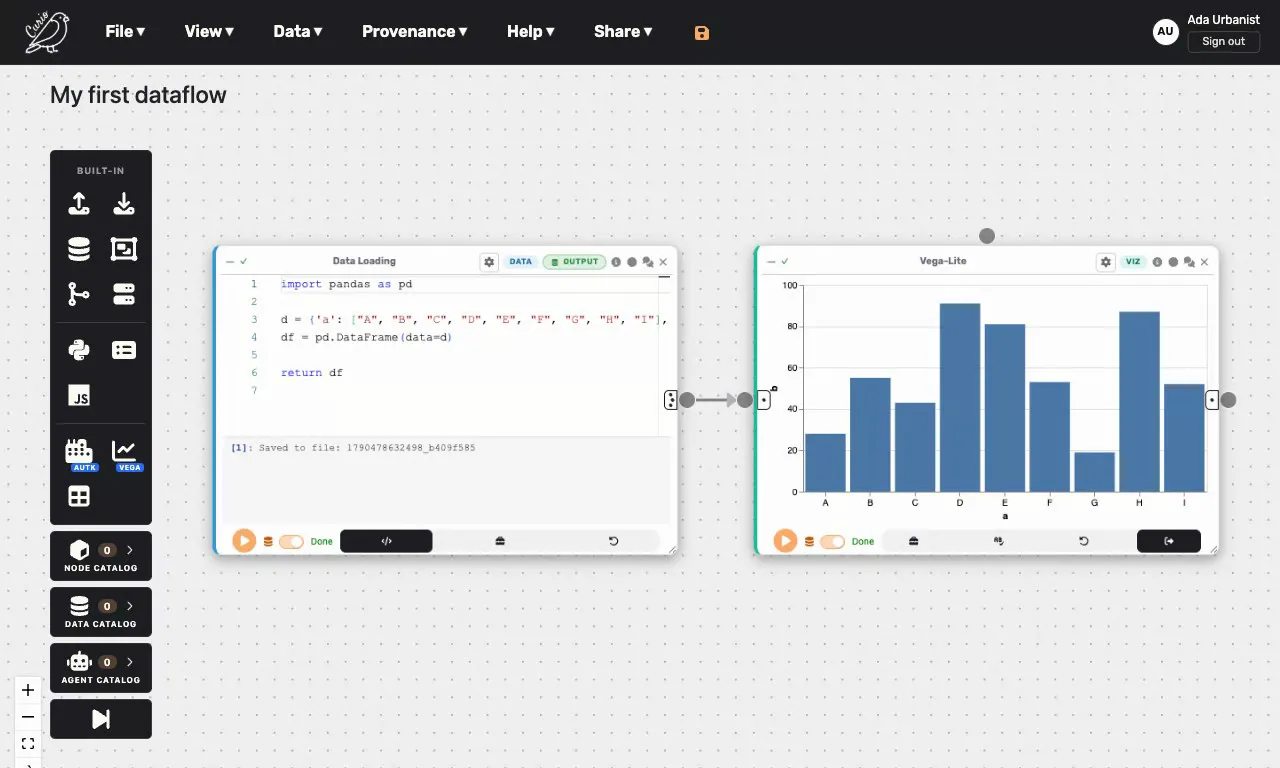
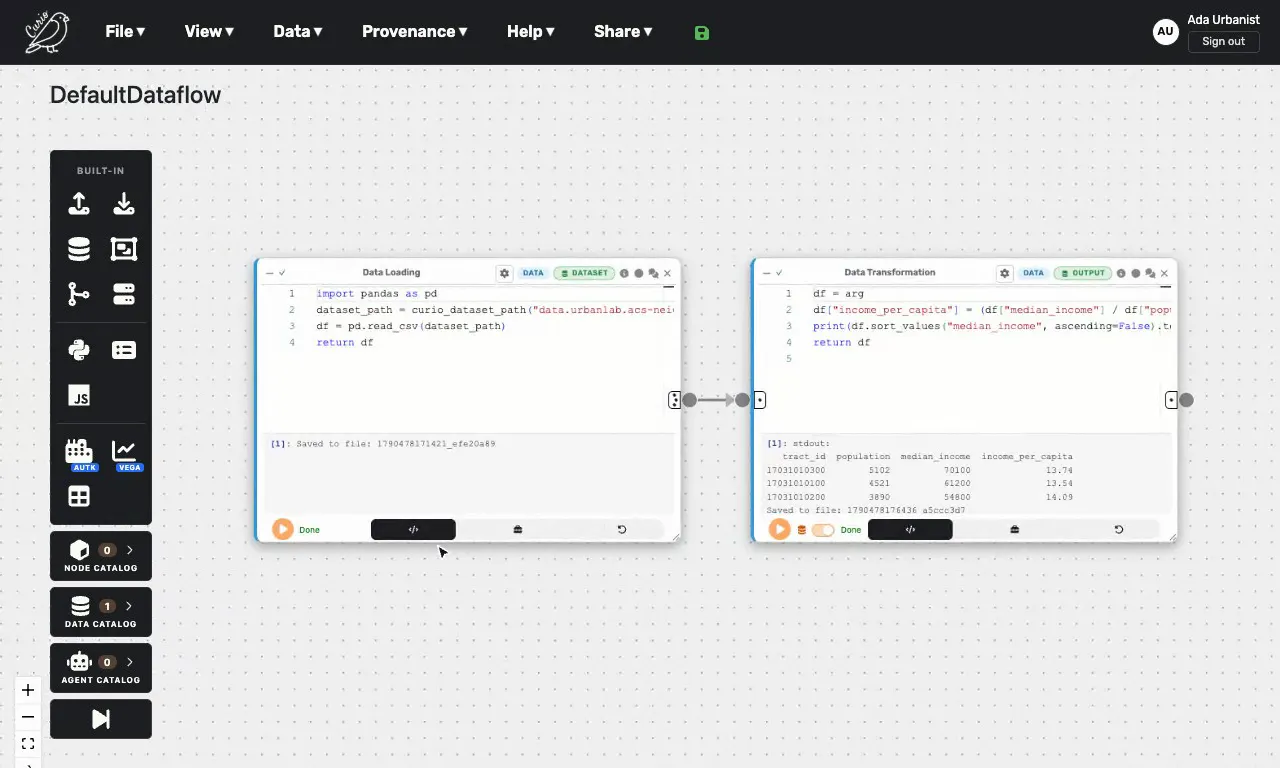
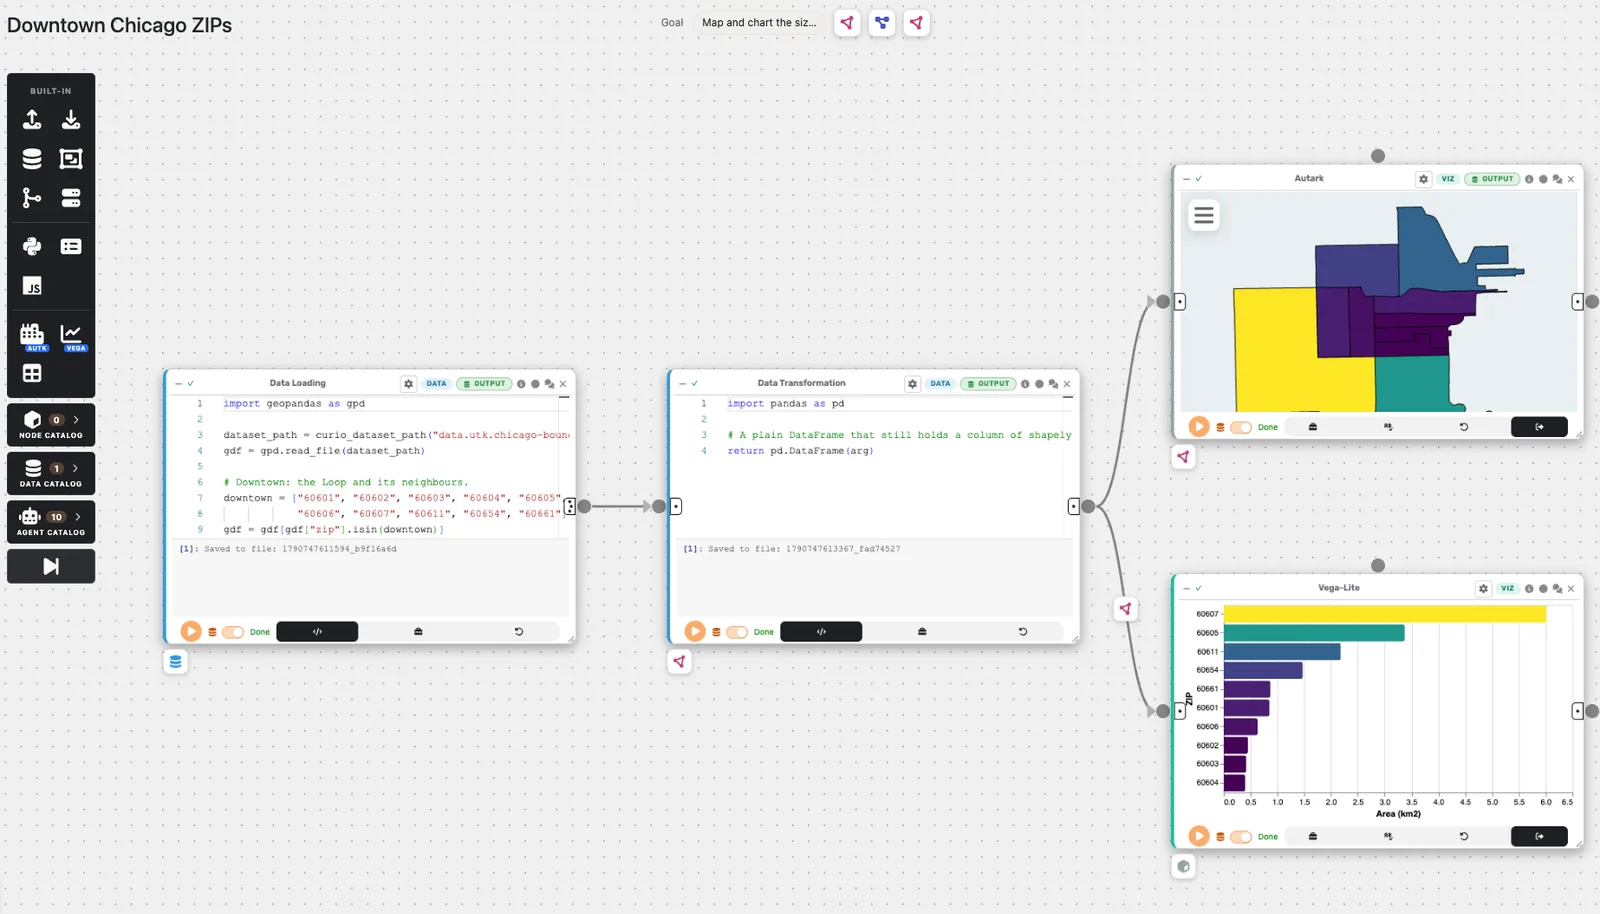
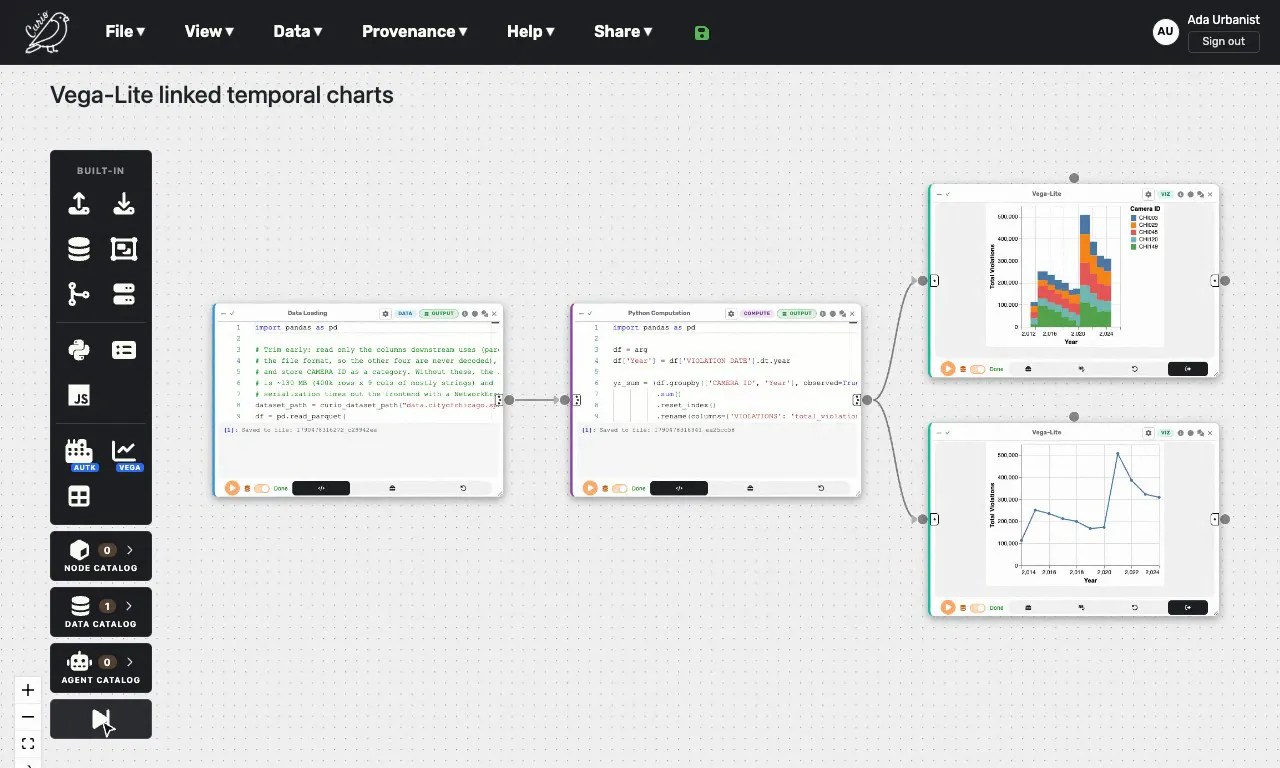
Load city data, transform it with Python, and build linked charts and maps in a dataflow that records every change. Use it in your browser, or run it on your own computer.


Find a dataset, load it, run models and compute with it, with AI agents at every stage. Curio composes the pieces into an analysis.
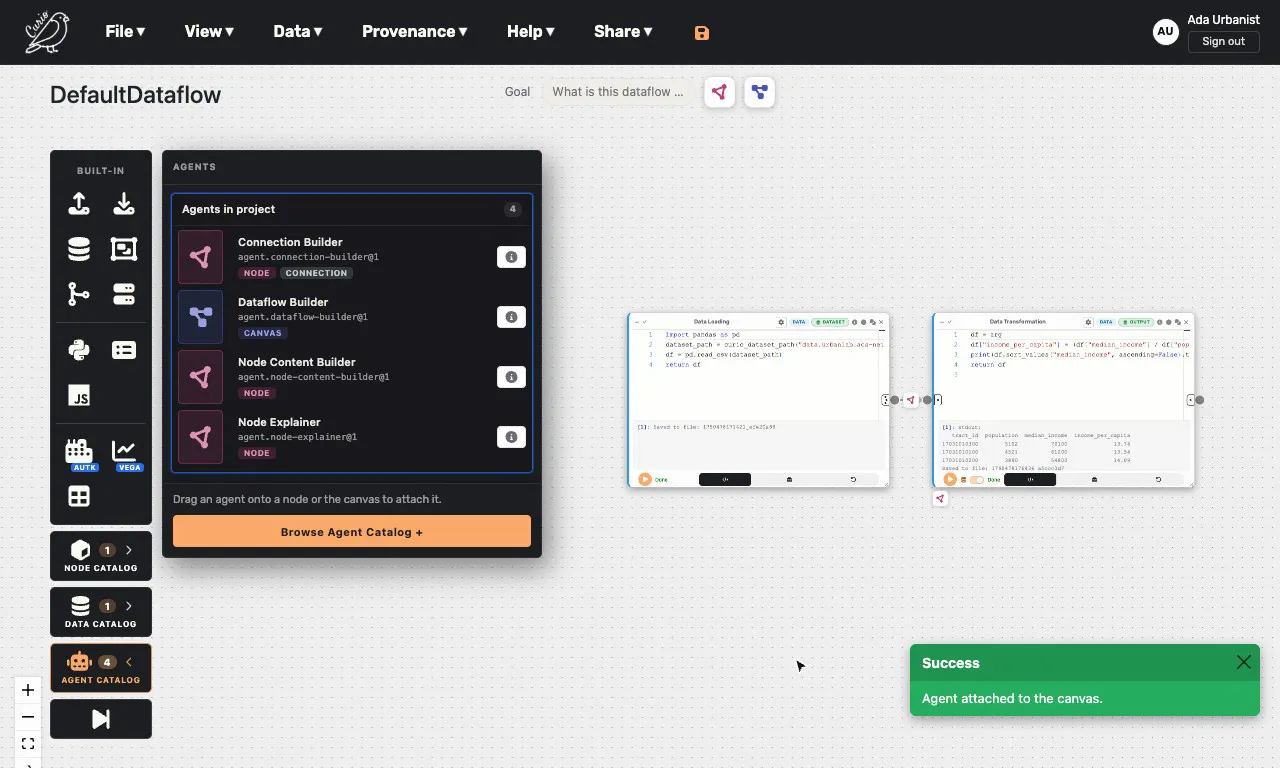
Ten AI agents you attach to a node, a connection or the whole canvas. Nothing changes until you apply what one proposes. AI agents
1Discover
Search open data portals, storage and services from one place, and bring datasets into your Data Catalog and models into your Model Catalog.
2Load
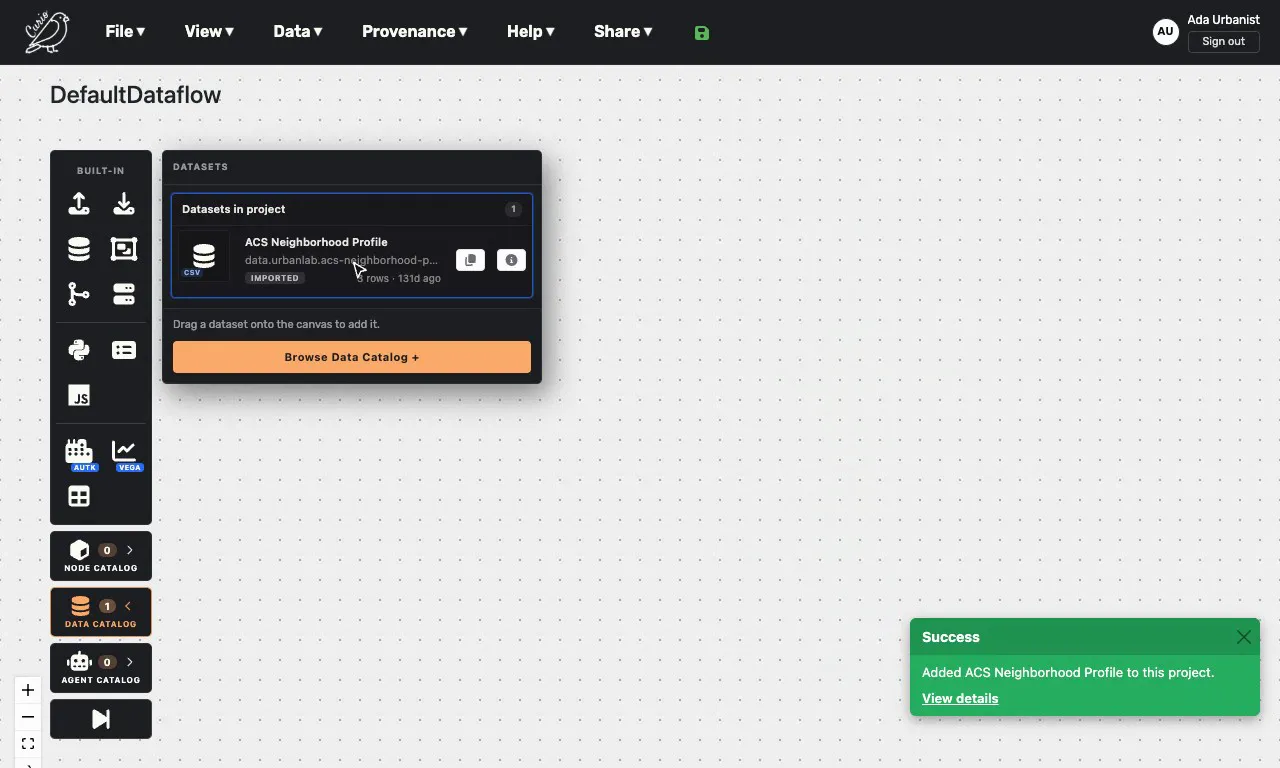
The datasets your dataflows read. Drag one onto the canvas and Curio writes the code that loads it.
3Infer
Trained models a node runs over your data, such as image segmentation for street photos. Drag one onto the node.
4Compute
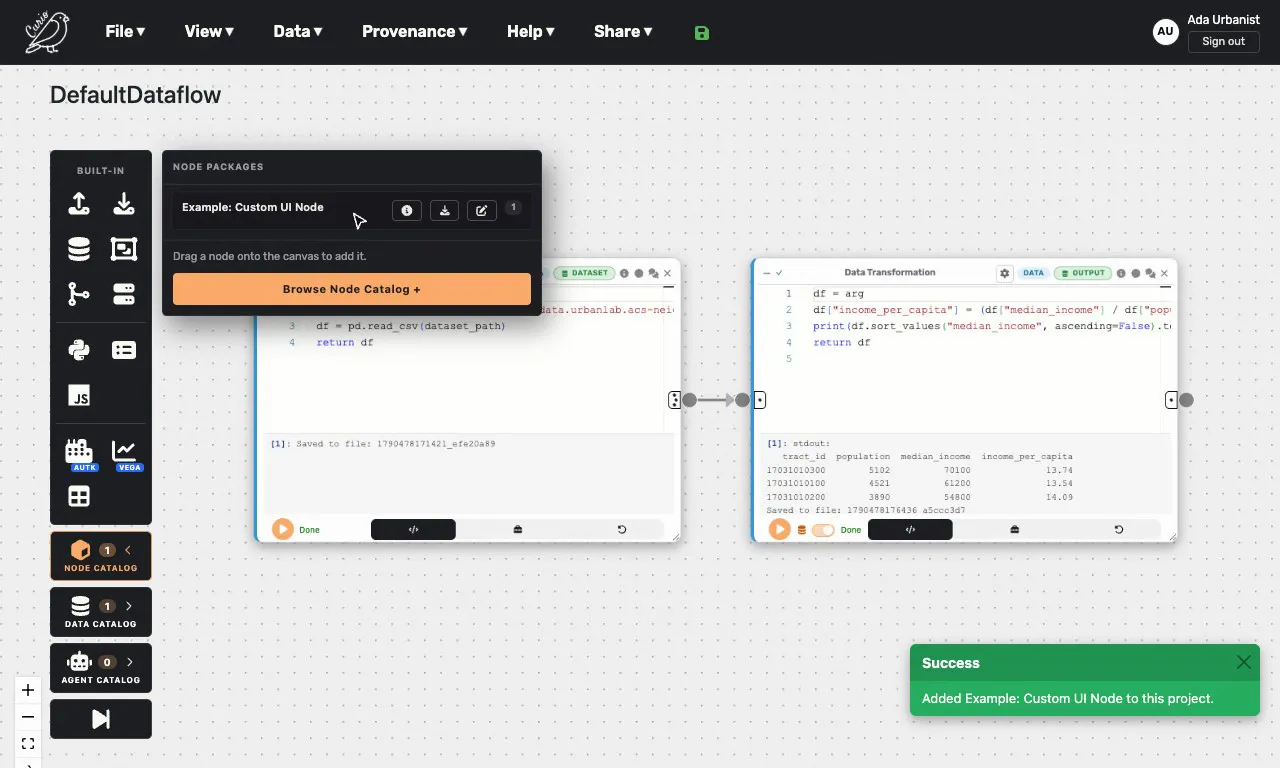
Node packages that transform, analyze and visualize, with the libraries they need.
Behind them, three helpers do part of the work and are never attached: the Dataflow Planner, the Dataflow Reader and the Generated Content Evaluator.
Dataflows that bring a city's data, models and views together in one place.
Use case 1In development
Bring footage from traffic and street cameras into a dataflow. Computer vision nodes turn what each camera sees into data, which you can map, chart and compare with the city's other datasets.
Use case 2In development
Find and fix the flaws in aerial orthoimagery before it feeds mapping and computer vision models. Each fix is a step in a dataflow, so it can be reviewed, run again on new tiles, and traced in the dataflow's provenance.
Use case 3In development
Run the same analysis on several cities and compare the results side by side. Build the dataflow once, point it at each city's data, and read the differences in linked maps and charts.

Use case 4
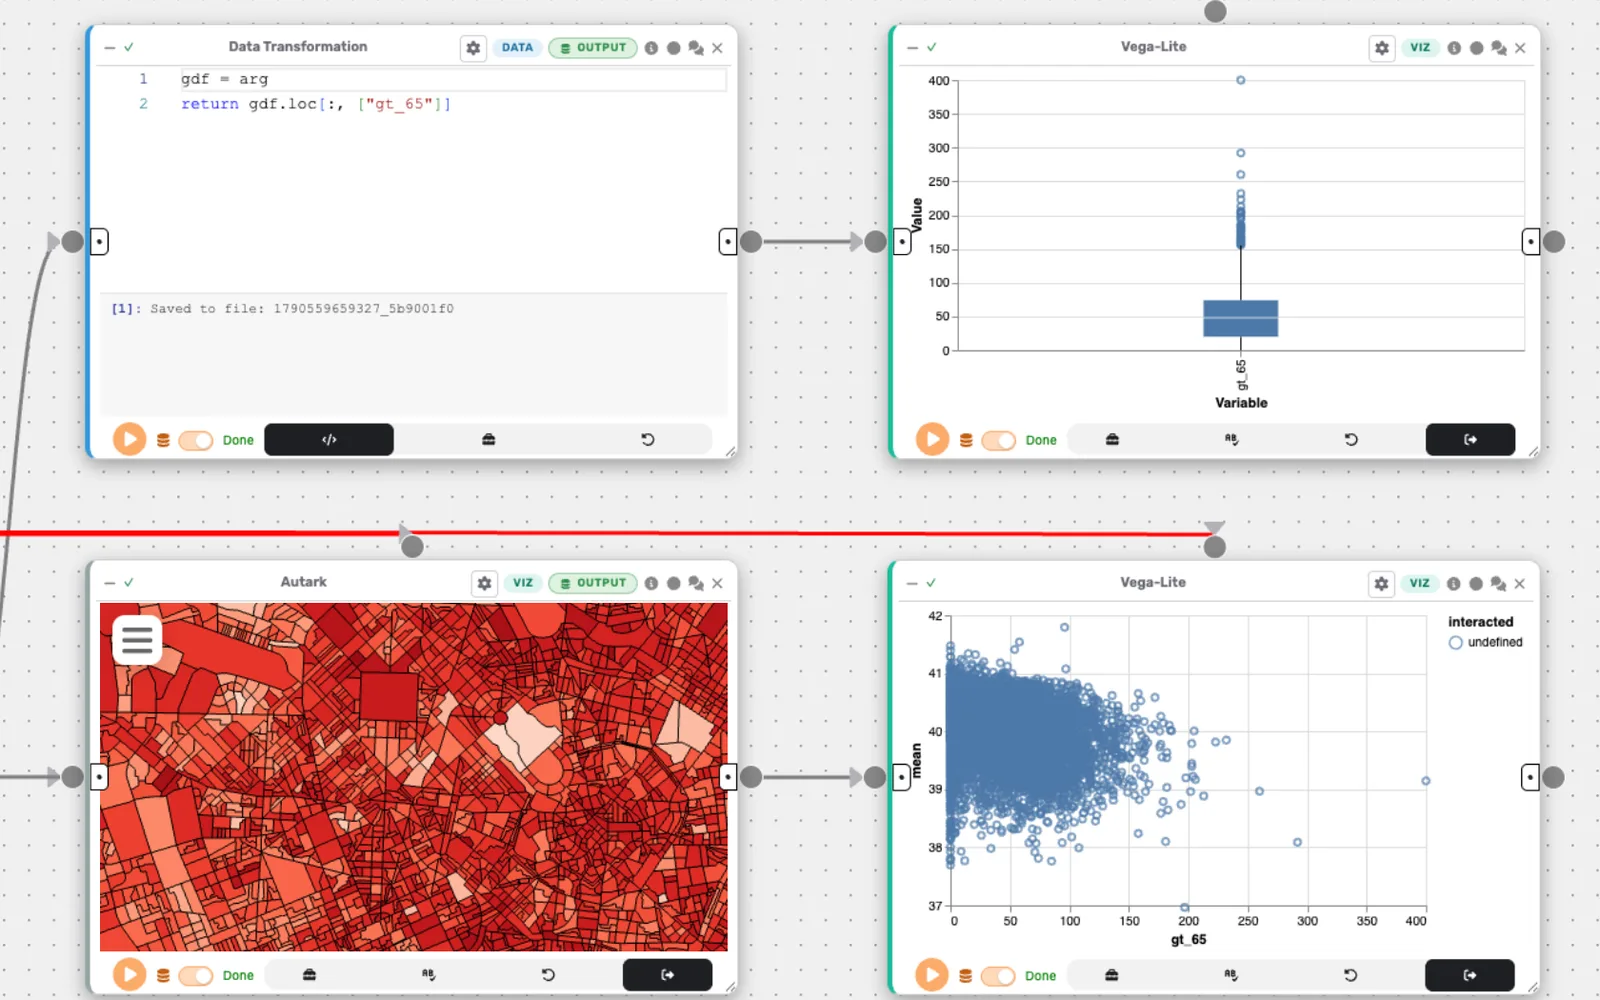
Combine weather records, climate rasters and census data to see which neighborhoods and residents are exposed to extreme heat or flooding. The Milan heat example, which ships with Curio, computes a thermal comfort index for every census tract and links a map with charts of residents over 65.
The Milan heat example
IntroductionWhat Curio is, how dataflows and nodes work, and the hosted instance versus your own install.
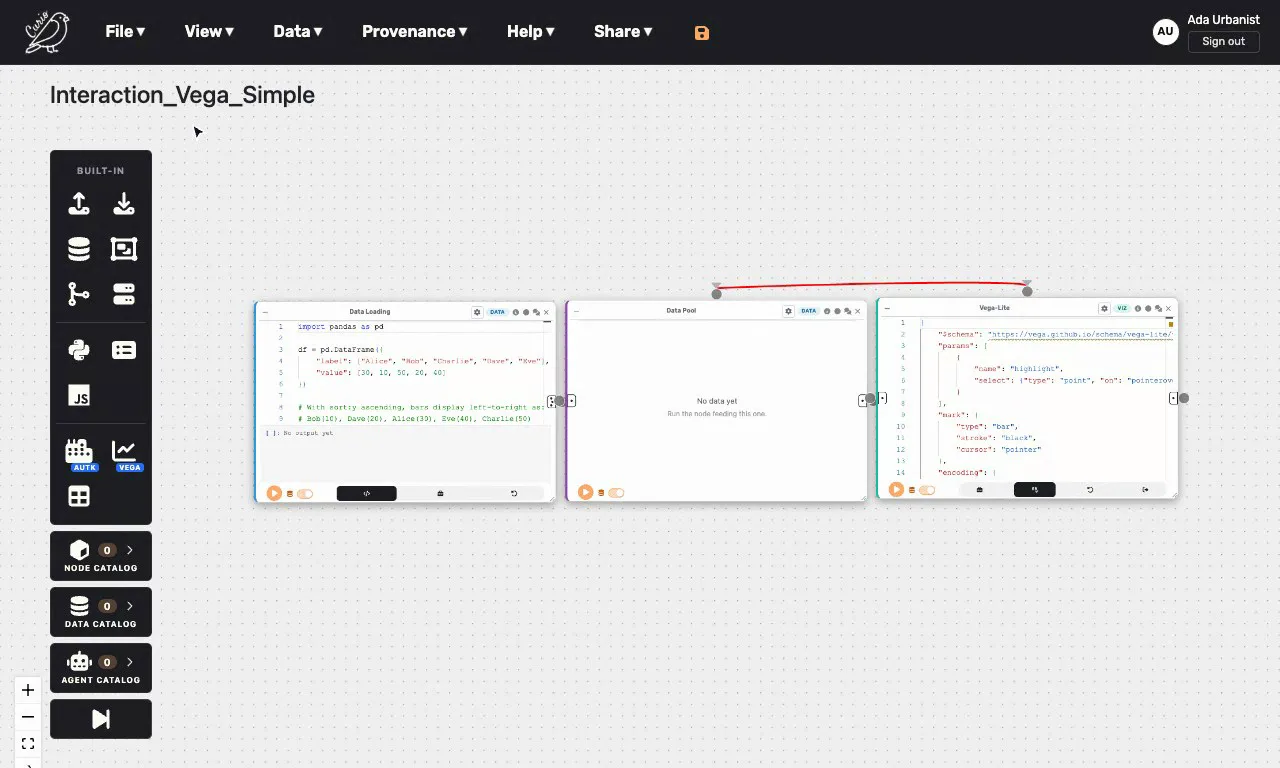
Quick startBuild a first dataflow in the hosted instance: make a small table and chart it with Vega-Lite.
Dataflows and nodesThe canvas, the built-in nodes, how to connect them, and how to run a dataflow.
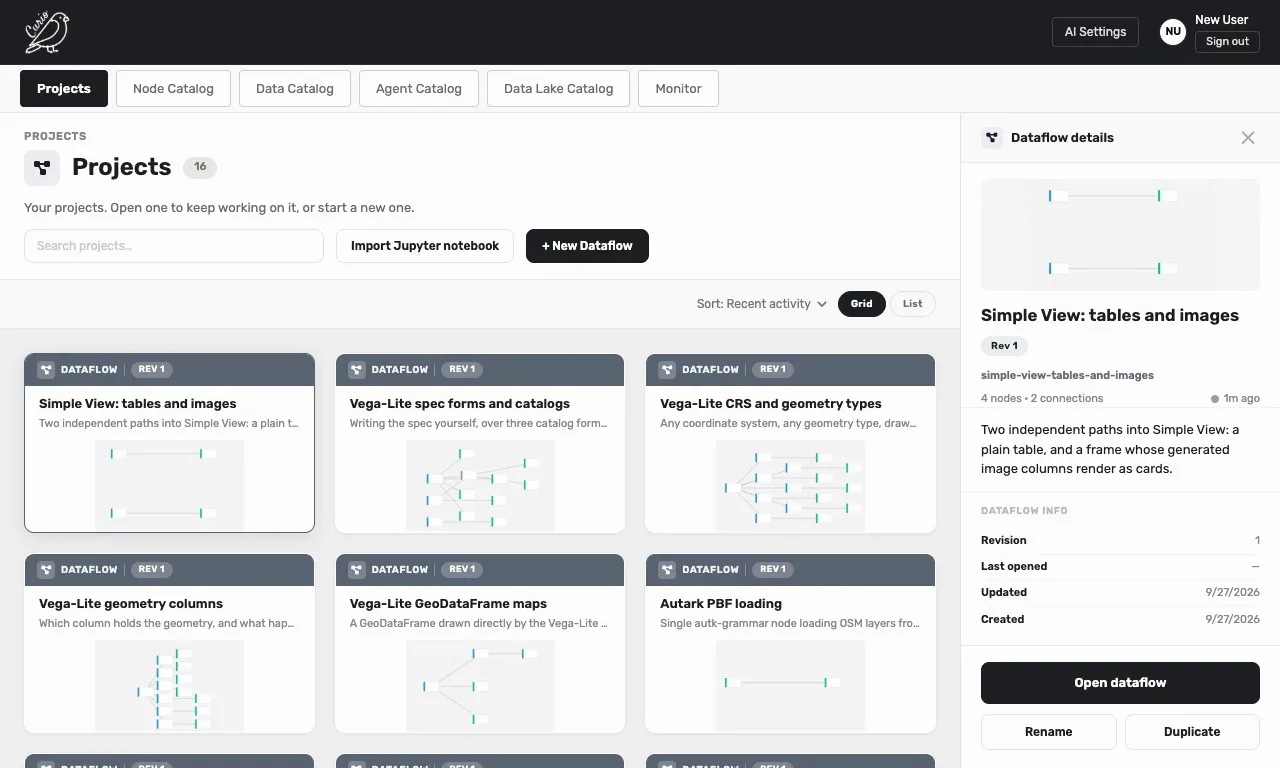
Projects and filesYour projects, the examples every account starts with, saving and loading dataflows, and Jupyter notebooks.
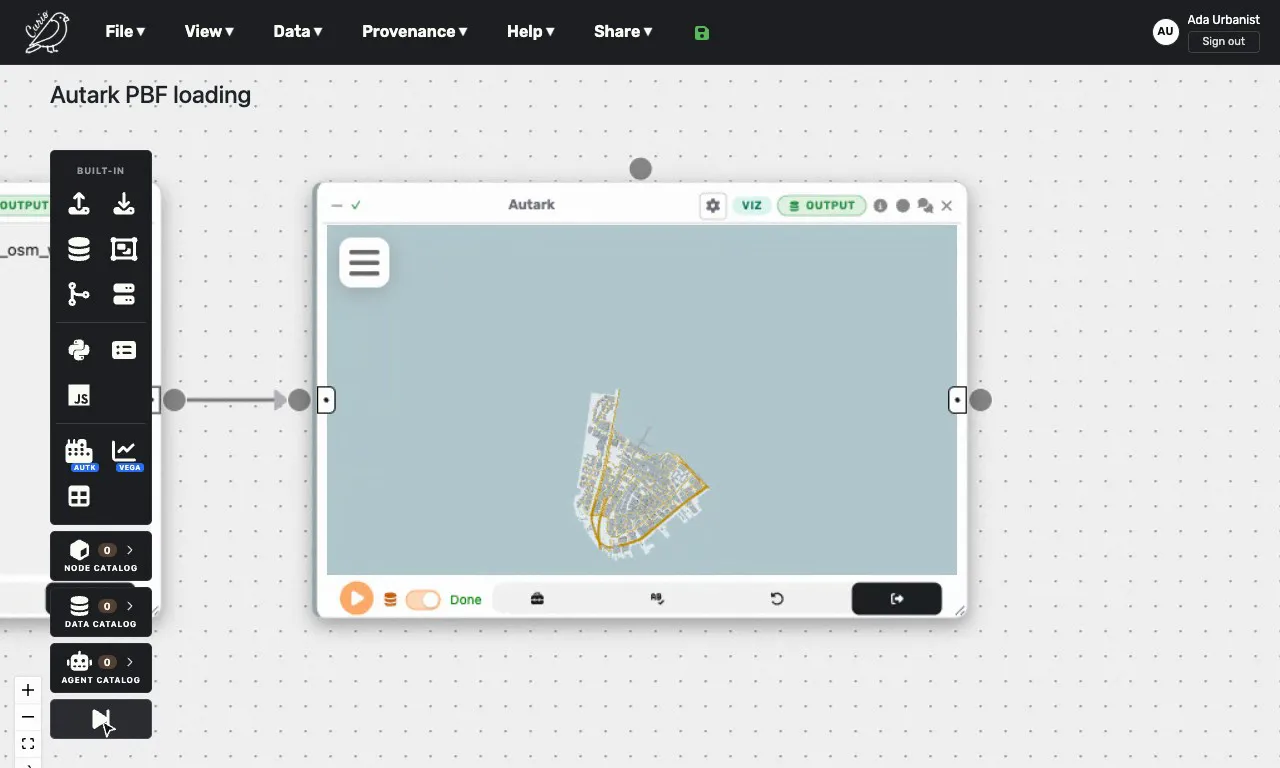
Charts and mapsVega-Lite charts, Autark maps, and simple views of tables and images.
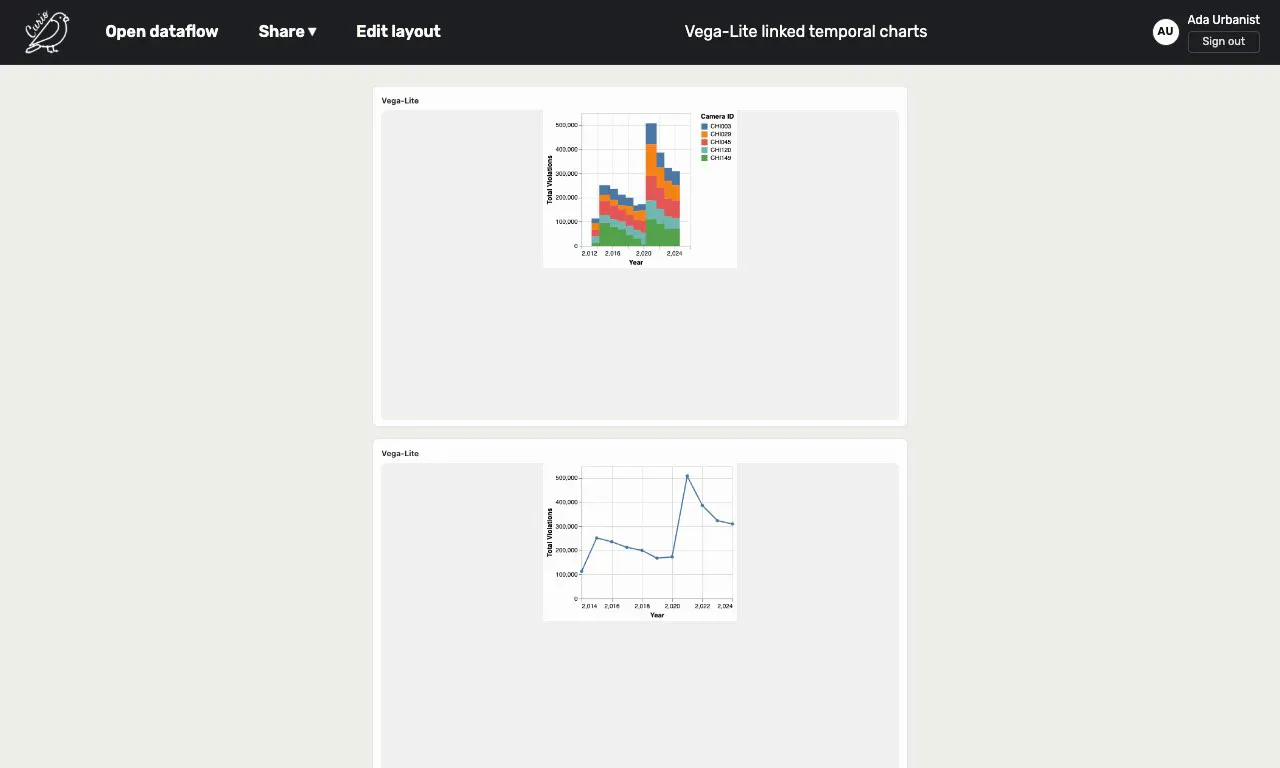
Linked viewsSelect in one chart or map and see the selection everywhere it is linked.
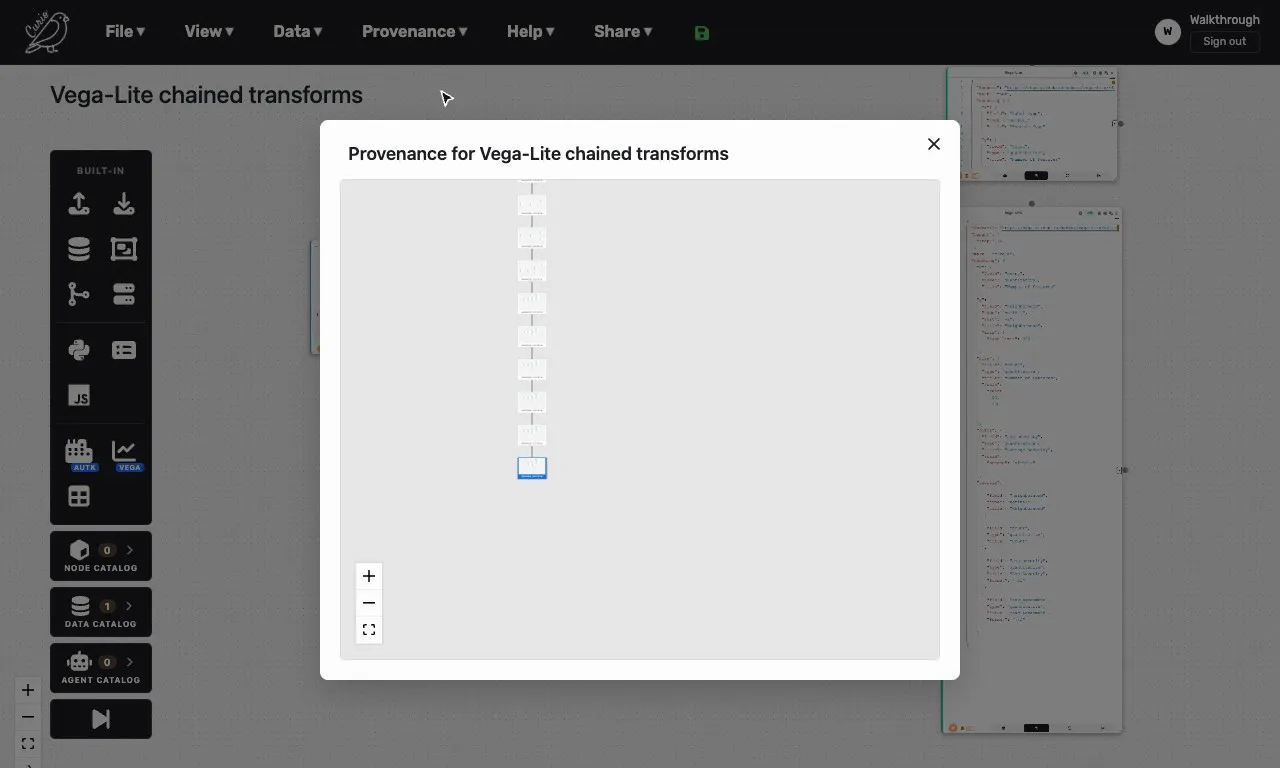
ProvenanceCurio keeps a version history of each dataflow and a run history of each node, so you can go back to an earlier version.
Data CatalogDatasets you can drag onto the canvas, your own files, and the outputs your dataflows save.
Nodes and packagesAdd node packages to a project from the Node Catalog, and install the Python libraries they need.
AI agentsAttach AI agents to a node, a connection or the whole canvas, and choose the model they use.
Dashboards and sharingPin nodes to a dashboard page, share it with a link, or share the dataflow itself.
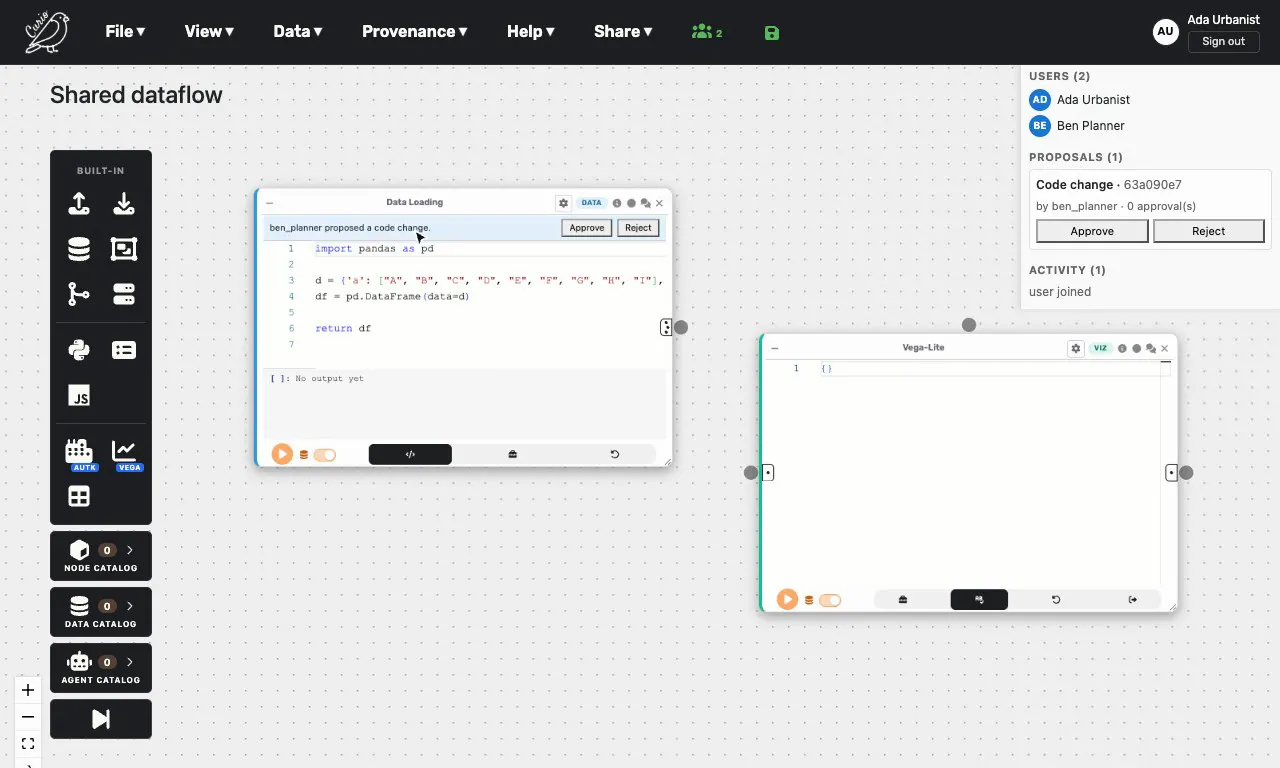
CollaborationEdit one dataflow together in real time, on a Curio server you start with collaboration turned on.
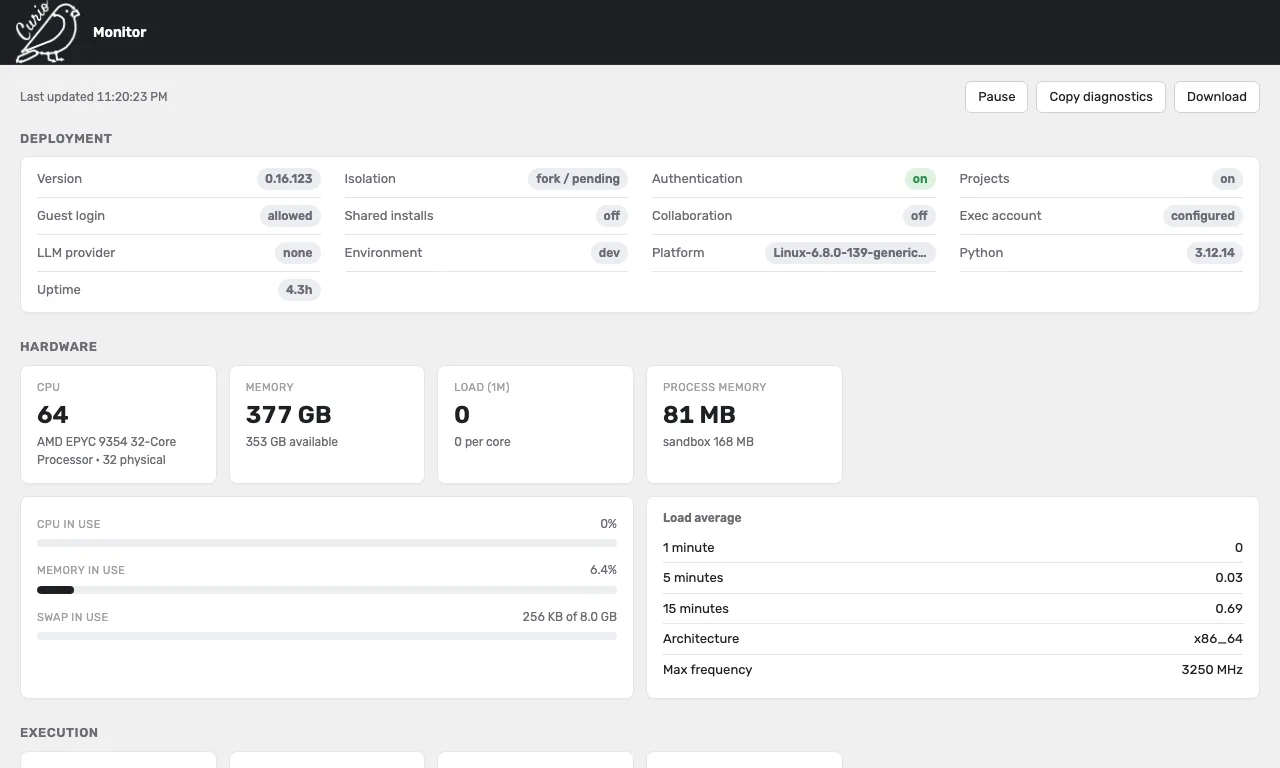
Run your own serverHost a multi-user Curio with Docker behind HTTPS: sign-in, isolated node code, configuration, updates, backups and monitoring.
Write a nodeTurn your own Python into a reusable node, or build a node with its own interface, and export it to share.