

Scenarios
A scenario is a named selection of a dataflow's nodes, or the whole dataflow, kept to compare alternatives: the same shadow study with buildings twice as tall, say, or with two towers removed. Its boundary splits the dataflow into three parts:
- Fixed context: the nodes outside the scenario that it reads, through a connection or through a Parameter node. The scenario takes their outputs as given. A node that two alternatives share sits outside both, as their common context.
- Levers: the nodes in the scenario, which is what an alternative changes: its loaders, widget values, code and specs, and the features it removes or changes by hand.
- Outcomes: the outputs of the scenario's last nodes, which is what gets compared.
A node belongs to one scenario at most.
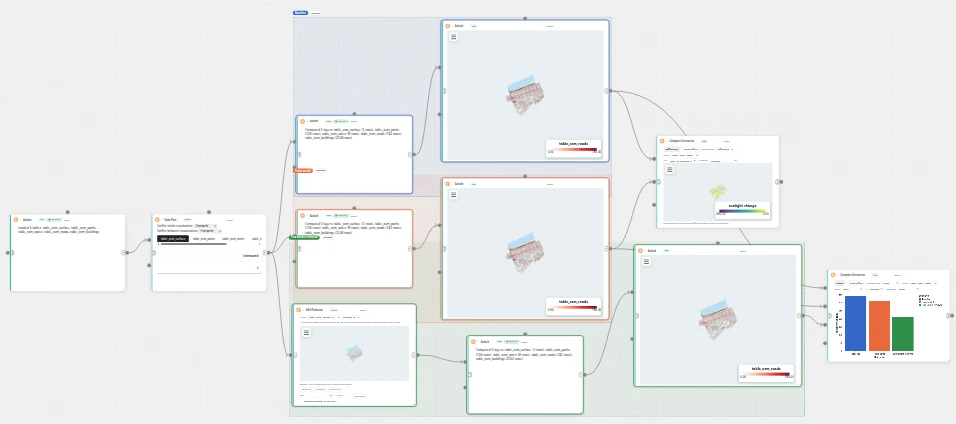
Make a scenario
- Select its nodes: hold Shift and drag a box around them.
- Choose View > Save selection as scenario, or File > Save dataflow as scenario for the whole dataflow.
- To build an alternative, choose View > Duplicate as scenario. The selected nodes are copied below themselves with the connections between them, every connection into the selection feeds the copy too, and the selection and the copy become two scenarios.
- Change the copy's levers: a widget value, a line of code.
Each copy remembers the node it was copied from.
Work with scenarios
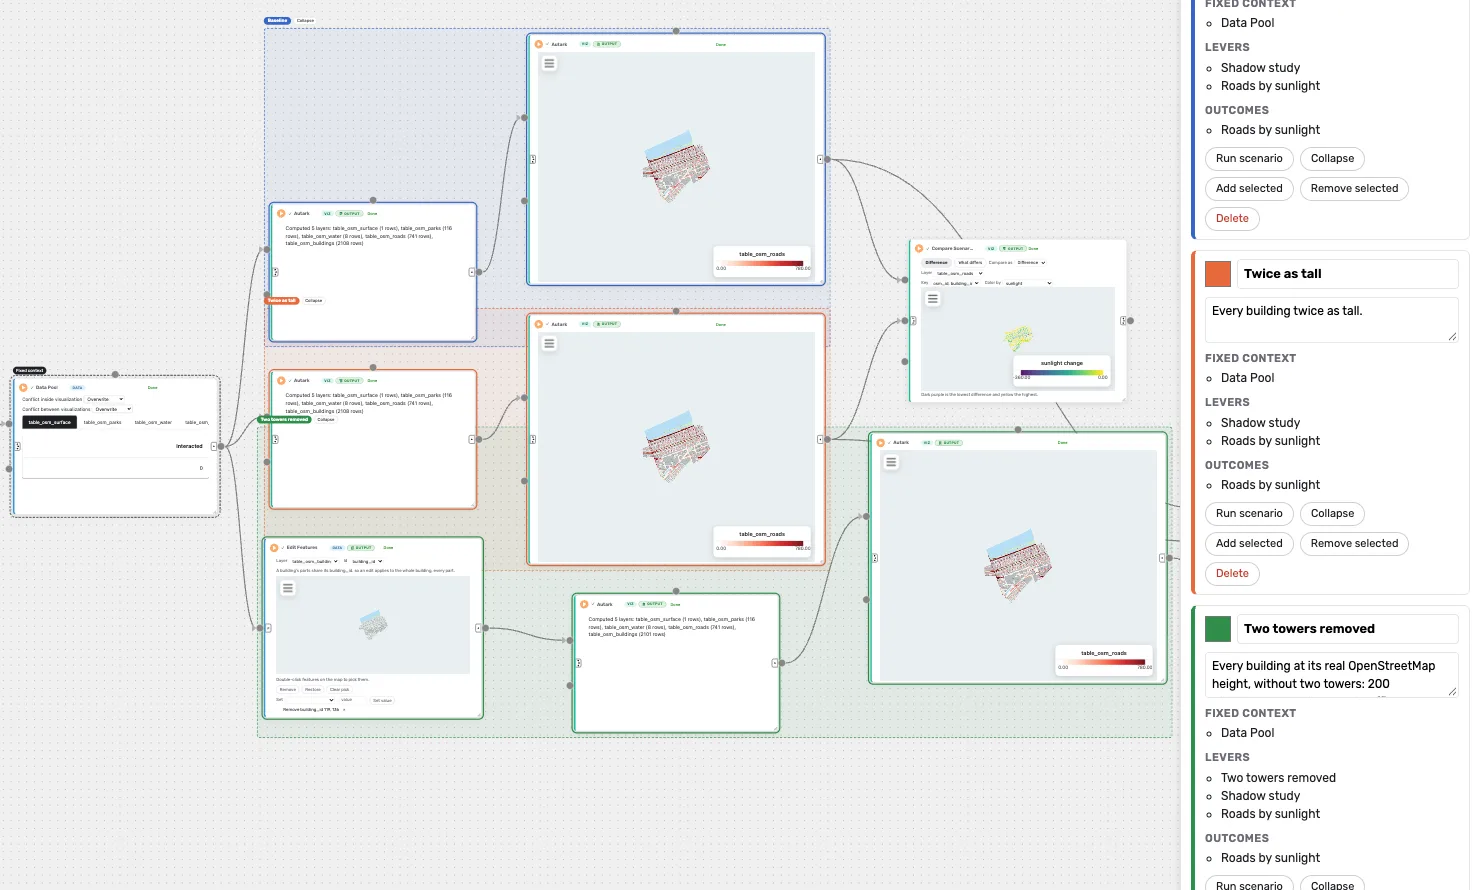
View > Show scenarios opens the Scenarios panel. For each scenario it lists the fixed context, levers and outcomes, and it lets you:
- rename, recolor and describe it;
- Run scenario: run its levers, and the nodes of its fixed context that have not run or have changed since;
- Collapse or Expand it;
- Add selected or Remove selected nodes;
- Delete it, which leaves its nodes on the canvas.
Pointing at a scenario in the panel marks its fixed context on the canvas.
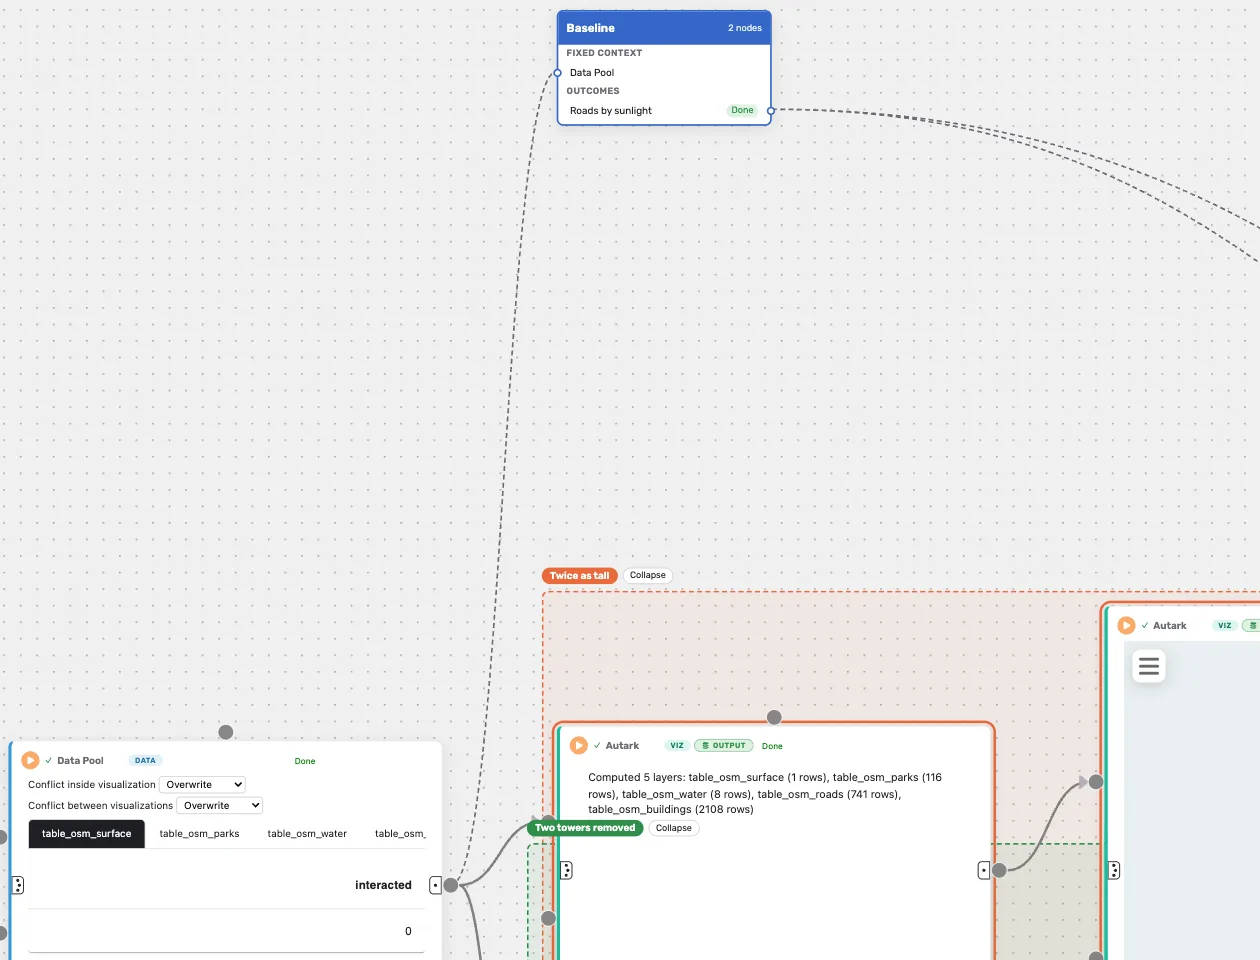
A collapsed scenario is one box in its color that lists its fixed context and its outcomes with their latest output. Its connections are drawn to the box, and dragging the box moves it. Double-click the box to expand it in place. A collapsed scenario's nodes still run with Run All, and the context they share runs once.
The nodes of a scenario's fixed context and its outcomes save their outputs to your Data Catalog when they run, whatever their Save output setting, so the Scenario Catalog can show them and other dataflows can use them. Scenarios, their colors, descriptions and collapsed state are saved with the dataflow.
Remove or change features by hand
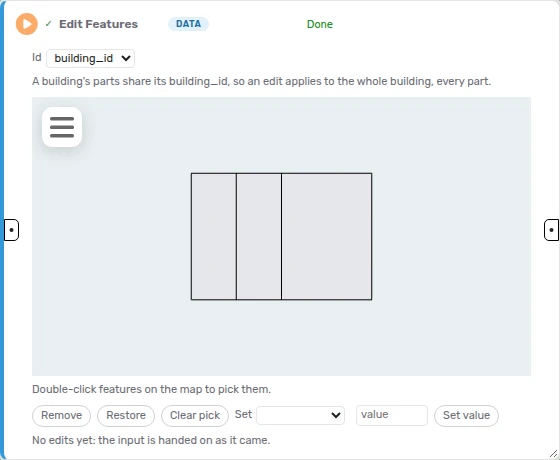
The Edit Features node takes features out of a layer, or changes their values, by hand: two towers taken out of a city's buildings, say. In a scenario, it is a lever.
- Drag Edit Features from the palette onto the canvas and connect a layer to it: a Python node's GeoDataFrame, or the layers an Autark node or a Data Pool hands on.
- Pick the layer in Layer, when the input carries several, and the column that identifies a feature in Id, such as
osm_idorbuilding_id. - Double-click features on the node's map to pick them.
- Press Remove, Restore, or Set value with a column and a value. Each press adds an edit to the list under the map; the × beside an edit deletes it.
- Run the node.
The edits apply in order. An edit by building_id applies to every part of a building. The output is the edited layer, with the input's other layers as they came; the input itself is never changed.
Compare scenarios
The Compare Scenarios node compares scenarios' outcomes on the canvas.
- Drag Compare Scenarios from the palette onto the canvas.
- Connect each scenario's outcome to one of its input circles. Each input is labelled by its scenario.
- Run it.
It works in one of two ways, which Compare as switches:
- Chart stacks its inputs into one table, with each scenario's name on its rows, and draws it in the scenarios' colors as bars, grouped bars, lines, points, a pie, lollipops or a table. Pick the X and Y columns, and how the values of a group are combined in Combine: mean, sum, median, minimum, maximum or a count.
- Difference subtracts input 0 from input 1: two rasters cell by cell, or two layers or tables row by row, matched on
osm_id,building_idor a key you pick. It maps the difference, colored by a band or a number column, or by whether each row changed, stayed the same, was removed or was added.
The node starts in Difference when its two inputs are rasters or layers, and in Chart otherwise. What it makes is its output: other nodes can read it, and the node can be pinned to the dashboard.
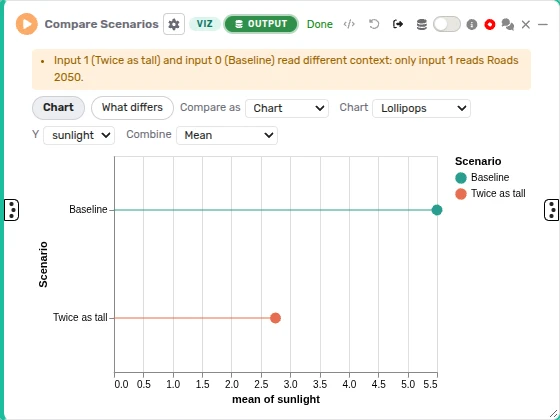
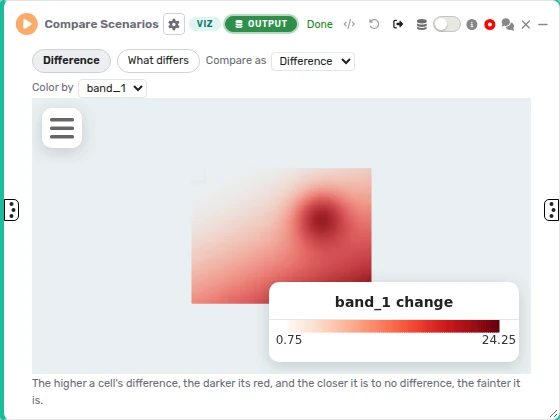
The What differs tab lists the levers that differ between the scenarios: the widget values and code lines that changed, and each scenario's Edit Features edits. A node and its copies count as one lever. Above the tabs, the node warns when the scenarios read different fixed context, when an input comes from a node in no scenario, and when two inputs come from one scenario.
In the examples
Example 06, "Autark what-if shadow study", has three scenarios over one loader: Baseline, Twice as tall (its height_factor widget set to 2), and Two towers removed (an Edit Features node takes out two towers). Its two Compare Scenarios nodes chart their mean road sunlight and map the sunlight each road loses. The SCOUT examples compare scenarios of shadows, flooding and routes.