

Linked views
Linked views respond to each other: select marks in one chart or map, and the matching rows light up in every view linked to it. In Curio, views are linked through a Data Pool, with interaction edges that carry selections back to it.
How linking works
A Data Pool sits between the data and the views. Its output connects to each view as usual, and each view that should send selections also has an interaction edge to the pool. When you select marks in such a view, the pool sets a column called interacted to "1" on the selected rows and "0" on the rest, then passes the updated table to every view connected to its output, and each one redraws. Because the selection travels as data, a Vega-Lite chart and an Autark map link as easily as two charts.
tour:interactionMaking an interaction edge
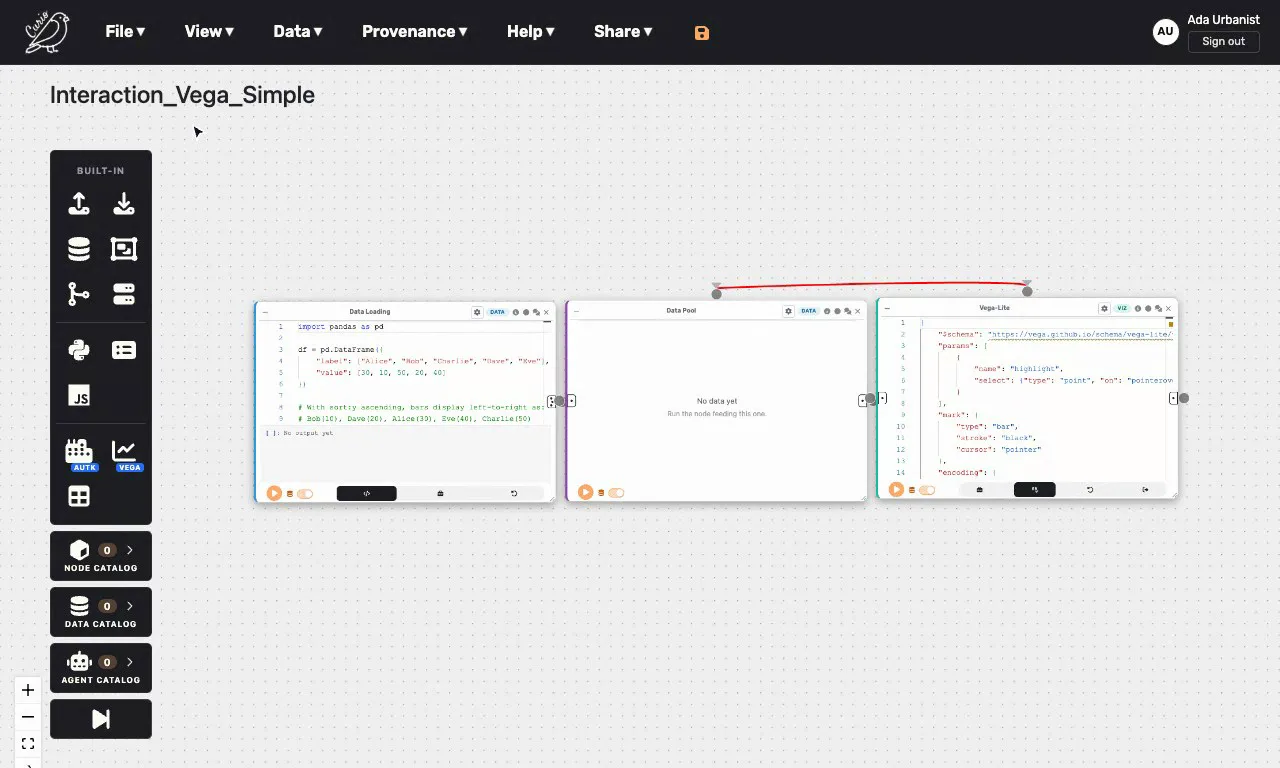
Vega-Lite, Autark, Simple View and Data Pool nodes each have a handle on their top edge. Drag from a view's top handle to the pool's top handle: the interaction edge is drawn in red, with arrows at both ends. A top handle connects only to another top handle, and interaction edges do not change the order in which nodes run.
A typical linked dataflow, like the "Heterogeneous data + linked views" example, loads the data, passes it through a Data Pool, and draws two or more views, each with a data connection from the pool and an interaction edge to it.
Which views take part
- Vega-Lite sends the selections declared in its specification's
params: a point, such as{"name": "pick", "select": "point"}, or an interval brush. To show linked selections, read theinteractedcolumn in the specification, for example"color": {"condition": {"test": "datum.interacted === '1'", "value": "red"}, "value": "grey"}. On ageoshapemap, use a point selection: a brush there does not reach the pool. - Autark sends picks on the map layer marked
"isPick": true, made by double-clicking a feature, and brushes on its plot. It highlights linked selections in its maps and plots on its own. - Simple View sends a row when you click one of its image cards, and outlines the cards of selected rows in red.
Views can also be linked inside a single node, with no Data Pool: a Vega-Lite specification with several views can connect them through its own params, and an Autark plot can brush the map layer it names in mapRef.