

Quick start
This page builds a first dataflow in the hosted instance: a small table made in a Data Loading node, drawn as a bar chart by a Vega-Lite node. It takes a few minutes and needs nothing installed. If you run Curio on your own computer instead (see Install), skip the sign-in step; the rest is the same.
Sign in
Open the hosted instance and choose Create account on the sign-in page. A name, a username and a password are enough; the email is optional. A new account opens on the Projects page, which already holds its own copies of the example dataflows for you to open and change.
Continue as Guest lets you look around without an account, but a guest cannot save dataflows, and anything a guest adds, such as an imported dataset, is shared with every other guest.
Create a dataflow
On the Projects page, click + New Dataflow. The canvas opens with the built-in nodes in the rail on the left (hover a tile to see its name) and the File, View, Data, Provenance and Share menus along the top. Click the dataflow's name at the top to rename it.
Load a small dataset
Drag the Data Loading tile onto the canvas. The node opens on its code editor: paste this Python, which builds a small table and returns it to the next node.
import pandas as pd

d = {'a': ["A", "B", "C", "D", "E", "F", "G", "H", "I"], 'b': [28, 55, 43, 91, 81, 53, 19, 87, 52]}
df = pd.DataFrame(data=d)

return df
Click the orange play button at the bottom left of the node, or press Ctrl+Enter (Cmd+Enter on a Mac) while you edit it. The node shows Done when the run succeeds and Error when it fails.
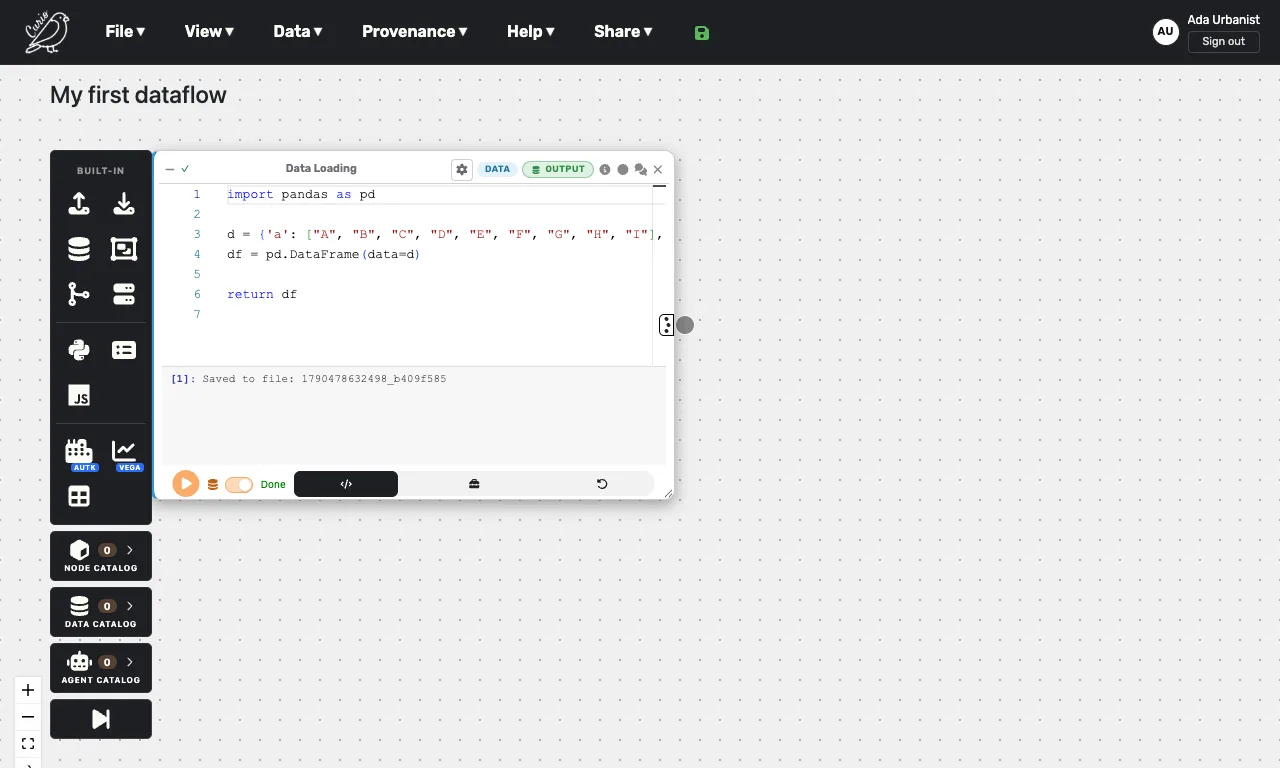
Chart it with Vega-Lite
Drag the Vega-Lite tile onto the canvas, then drag from the handle on the right edge of the Data Loading node to the handle on the left edge of the Vega-Lite node to connect them. The Vega-Lite node opens on its grammar editor. It may already hold a starter chart picked from the table's columns; replace it with this spec:
{
  "mark": "bar",
  "encoding": {
    "x": {"field": "a", "type": "nominal", "axis": {"labelAngle": 0}},
    "y": {"field": "b", "type": "quantitative", "stack": null}
  }
}
Click the Vega-Lite node's play button, and the chart appears in the node with one bar per letter. Playing a node first runs any node upstream of it that has not run yet or whose code changed, and Run all nodes, at the bottom of the rail, runs the whole dataflow.
Save it and bring your own data
Save with File > Save dataflow, or click the disk icon next to the Share menu, which turns green once everything on the canvas is saved. After the first save, Curio also saves your changes automatically as you work. File > Save dataflow as downloads the dataflow as a file, which File > Load dataflow opens again.
To chart a file of your own, open Data > Data Catalog, click Import dataset at the bottom of the drawer and pick a CSV, GeoJSON or other supported file, then click Add to project on its card and confirm. Drag the dataset from the rail's Data Catalog list onto the canvas, and Curio creates a Data Loading node with the code that reads it. Data Catalog covers datasets in depth, and Charts and maps covers what Vega-Lite and Autark can draw.