SCOUT examples
SCOUT studies three urban questions: how much shadow tall buildings cast, how deep a flood gets with and without nature-based solutions, and which route avoids rain or wind. Curio runs each one with packages, models and datasets that ship with it, in dataflows that compare scenarios. SCOUT's data and models are used with the permission of its authors.
Find them
The four dataflows are in the examples every account starts with, under By source on the projects page: "SCOUT building rasters" (example 24) under Examples, and FloodScenarios, ScoutShadows and WeatherRouting under Tests. On your own computer they come with --with-examples, which also installs the SCOUT packages.
Building rasters and shadows
- Rasterize Buildings, from the SCOUT Raster Conversion package, turns a buildings layer with heights in metres into SCOUT's zoom-16 height tiles, and a mosaic of them: one raster an Autark map draws.
- Accumulated Shadow, from the SCOUT Shadow package, runs Deep Umbra, SCOUT's shadow model in the Model Catalog, on that mosaic. It gives the minutes of a day the ground spends in shadow, as a raster on the same grid; its Season widget picks spring, summer or winter.
- Raster Statistics then gives the mean and median shadow over the ground.
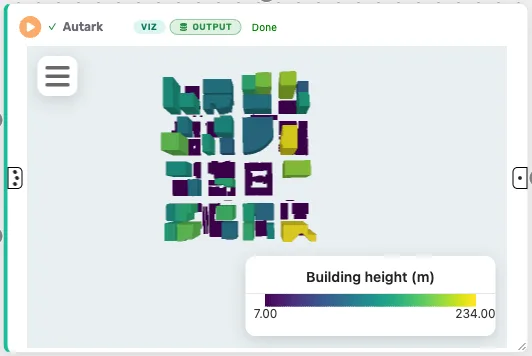
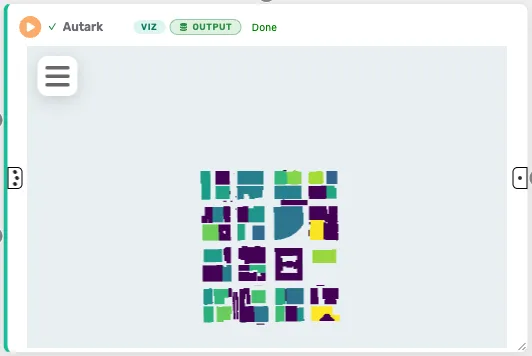
Example 24, "SCOUT building rasters", runs them on the buildings of SCOUT's Chicago Loop example: the buildings in 3D, the height mosaic and the summer shadow on Autark maps, and the mean and median shadow.
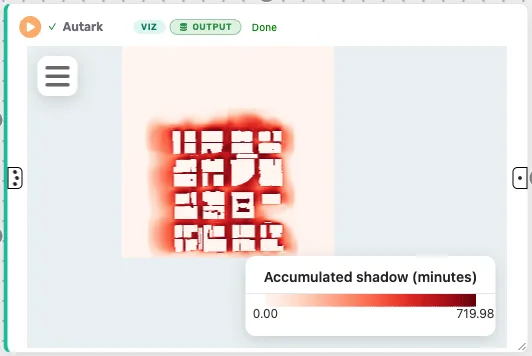
ScoutShadows compares two scenarios of the same buildings over a shared season, Existing and Towers removed (15 buildings taken out): one Compare Scenarios node charts the mean shadow, and another maps its change.
Deep Umbra ships with Curio's repository and its Docker image, but not with the pip package; on a pip install, Accumulated Shadow says the model is missing and how to add it.
Flooding and nature-based solutions
FloodScenarios is SCOUT's flood study of the Quad Cities, built from Curio's own nodes:
- three Parameter nodes set the period (2020 to 2040, 2050 to 2080 or 2080 to 2100) and the region's two corners;
- Data Loading nodes read only that region's window of SCOUT's flood depth rasters, with and without nature-based solutions (NbS), and of its raster of where each solution would go;
- in each of two scenarios, No NbS and NbS, a Raster Calculator takes the depth with NbS where the class is one of the solutions its widget checks, and the depth without NbS elsewhere, and a Raster Statistics node gives the median and mean depth.
Two Compare Scenarios nodes then map the change in depth, NbS minus No NbS, and chart each scenario's median depth.
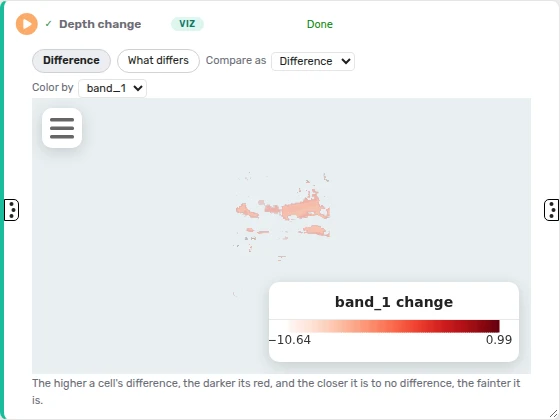
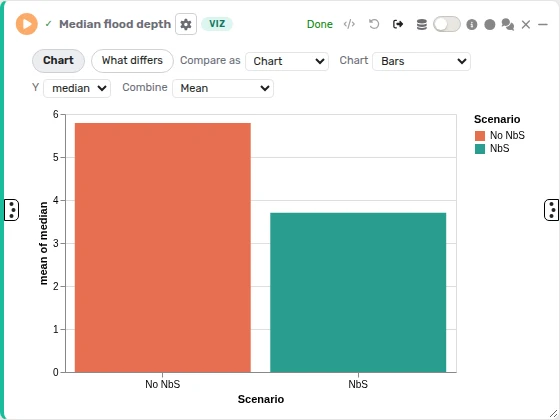
The Raster Calculator and Raster Statistics nodes work on any rasters on one grid, from a Python node or the Data Catalog. A Data Loading node reads only part of a large GeoTIFF when its curio_load_data call is given bounds.
Weather-aware routing
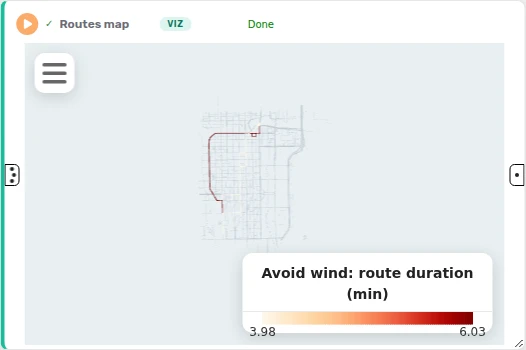
Weather Routing, from the SCOUT Routing package, finds routes between two points over a roads layer. It weighs each road by the weather that SCOUT's weather graph network, in the Model Catalog, predicts on it from SCOUT's WRF forecast in the Data Catalog. Its widgets set the origin and destination, the start time, the mode, and the rain and wind weights; the forecast runs from 5 July 2025, 19:00, to 7 July, 19:00, Chicago time. It outputs the routes, which an Autark map draws, and a table of each route's duration, distance and rain, heat, wind and humidity exposure, which Compare Scenarios charts.
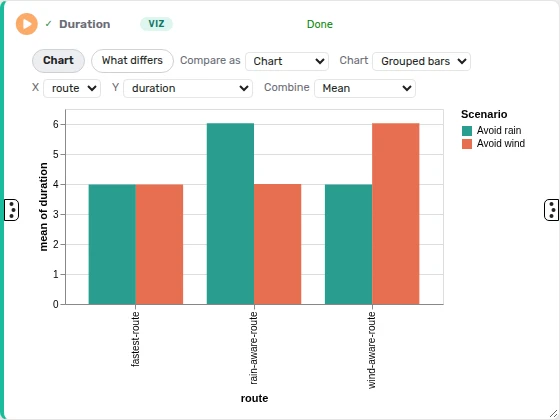
WeatherRouting runs it over the Chicago Loop's roads from an Autark node, with a start time the two scenarios share, Avoid rain and Avoid wind, which weigh rain and wind differently. An Autark map draws the routes, and four Compare Scenarios nodes chart their duration, distance and rain and wind exposure.