Dashboards and sharing
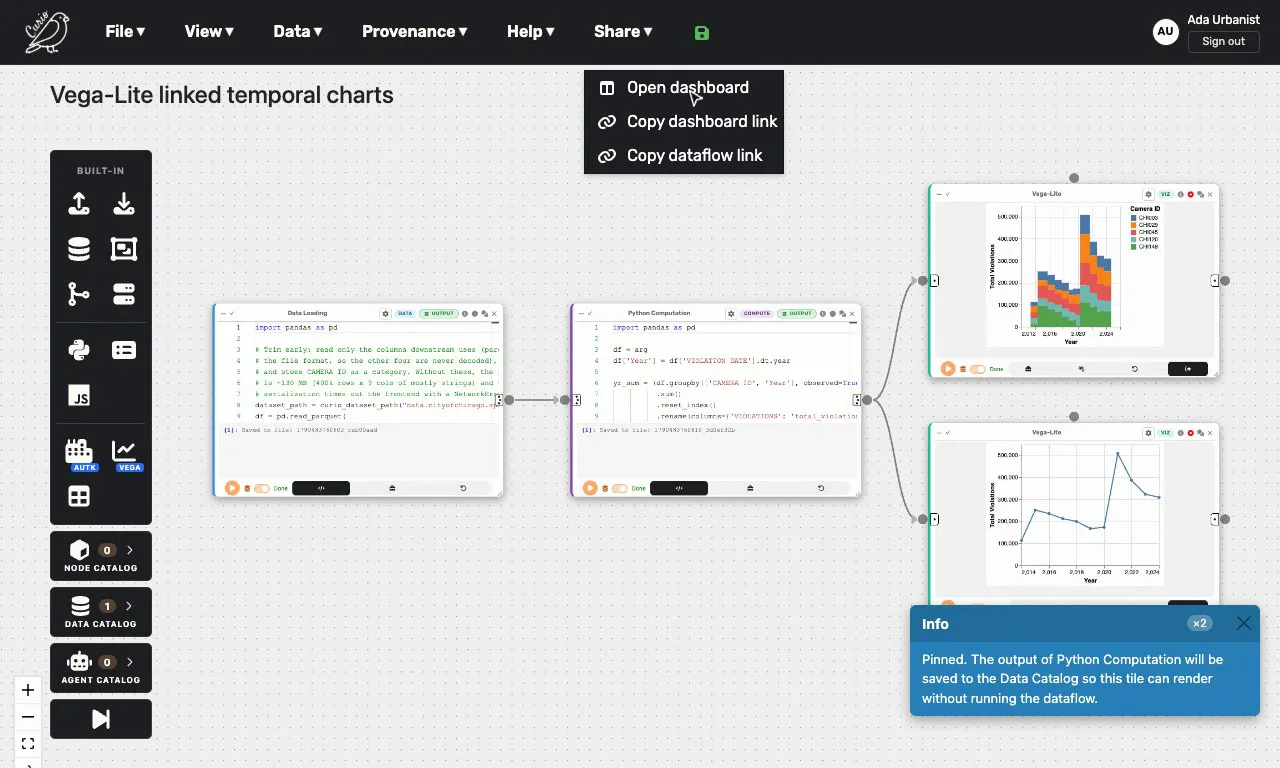
Every dataflow has a dashboard: a page of its own that shows only the nodes you pin, ready to present. Share its link and people see your charts and maps without running anything, or share the dataflow's link so they can open the whole canvas.
Pin nodes
Each node has a small circle in its header, labelled Pin to dashboard. Click it on the charts and maps you want to show, and it turns into a red dot; click it again (Unpin from dashboard) to take the node off. Pinning also means the data behind those nodes is saved to your Data Catalog when the dataflow runs, and that saved data is what the dashboard draws.
After pinning, run the dataflow and save it. The dashboard shows the last saved version: save again whenever you change pins or rerun nodes.
Open the dashboard
On the canvas, choose Share > Open dashboard. The dashboard opens in a new tab at an address of its own, and its tiles draw from the saved outputs, with nothing to press. Open dataflow, at the top, takes you back to the canvas.
As the owner, click Edit layout to move tiles by their title bar and resize them, then Save layout. This arranges the dashboard only: nodes keep their places on the canvas. If nothing is pinned yet, the page says so and links back to the dataflow.
A map made with Autark draws in the viewer's own browser, so it needs a browser with WebGPU. Text that a code node prints is not shown on the dashboard.
Share a link
The Share menu offers two links, and both need the dataflow to be saved first:
- Copy dashboard link copies the dashboard's address. Visitors see the pinned tiles, read-only.
- Copy dataflow link copies the canvas address. Visitors see the whole dataflow, read-only, and File > Save dataflow saves a copy to their own workspace.
Anyone who can sign in to that Curio server can open either link. If the server allows guests, the sign-in page also offers Continue as Guest. The dashboard has the same Share menu, with both links.
To edit a dataflow with other people at the same time, see Collaboration.