

Charts and maps
Three kinds of node draw what flows into them. A Vega-Lite node draws a chart from a JSON specification, an Autark node draws maps and plots of city data, and a Simple View shows a table or a set of pictures with nothing to write.
Vega-Lite charts
Connect a table, such as a pandas DataFrame or a GeoPandas GeoDataFrame, to a Vega-Lite node and write its specification in the Grammar tab. Curio supplies the rows, so the specification leaves out data and names columns directly:
{
  "mark": "bar",
  "encoding": {
    "x": { "field": "neighborhood", "type": "nominal" },
    "y": { "field": "vegetation_pct", "type": "quantitative" }
  }
}
Press play to draw it. If the editor is still empty when data first arrives, Curio fills it with a starter specification chosen from the column types. For a GeoDataFrame, "mark": "geoshape" draws a map, and Curio picks the geometry column and a projection unless you set them yourself. A chart with several views keeps its size, and the node scrolls to show all of it. Once a chart has a specification, it redraws by itself whenever new data arrives.
Autark maps
An Autark node takes one JSON specification, called an UrbanSpec, with up to four parts: data loads OpenStreetMap, CSV or GeoJSON data; compute runs a GPU shader written in WGSL; map draws layers in 2D or 3D, colored by a column; and plot adds a chart such as a histogram. A node with only data passes its layers on, named after their tables (such as table_osm_buildings), for another Autark node to draw. A single table from another node arrives as a layer named upstream, here colored by its mean column:
{ "map": { "layerRefs": [{ "dataRef": "upstream", "getFnv": "mean", "getFnvType": "quantitative" }] } }Maps, plots and compute need a browser with WebGPU, such as a recent Chrome or Edge. Without it, the node says WebGPU is not available, and its Check again button asks the browser again.
Simple View
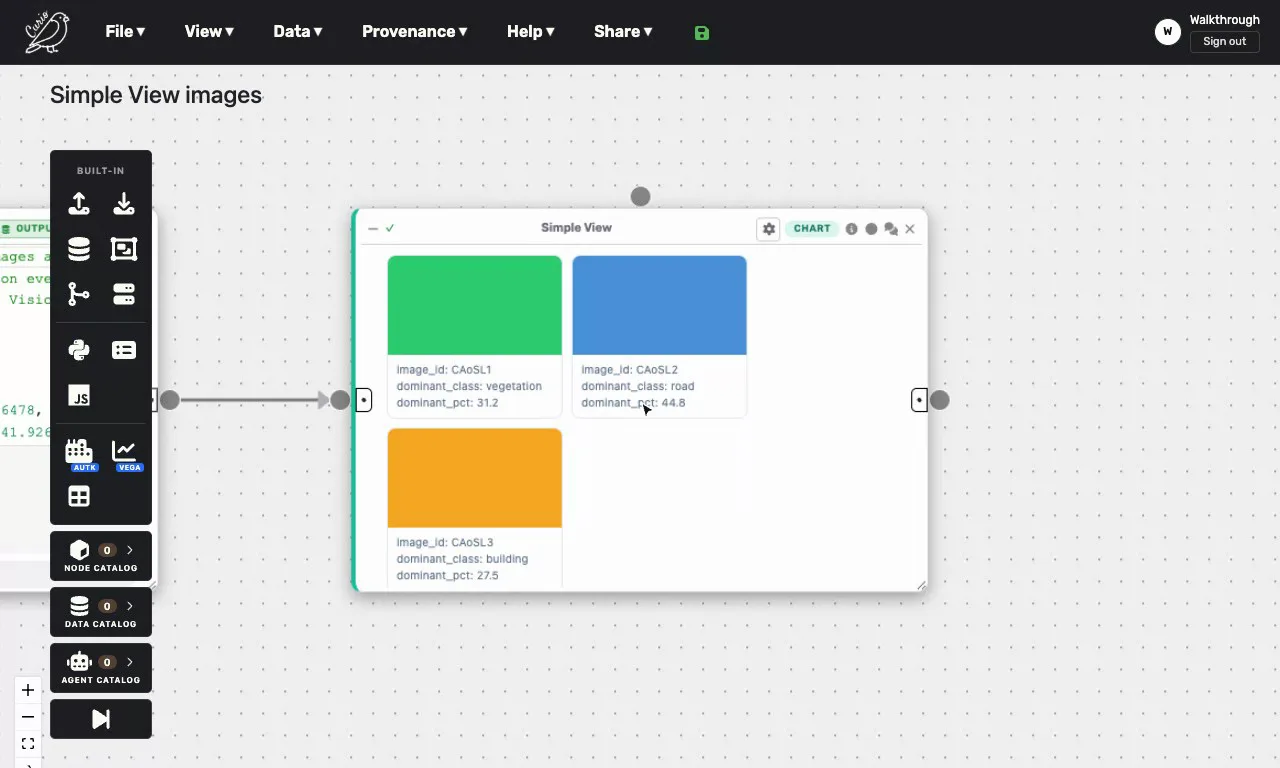
A Simple View node needs no specification. It shows a DataFrame or GeoDataFrame as a table, or as one card per row when a column holds pictures, either links to images or images stored in the data; with several such columns, Image column picks which one to show. Anything else, such as a number, a list or JSON, appears as text with a Copy text button.
In the example gallery
The examples in your projects show each of these at work. "Vega-Lite GeoDataFrame maps" draws maps with Vega-Lite, "Autark PBF loading" and "Autark GPU shader" build Autark maps, "Simple View: tables and images" covers Simple View, and "Heterogeneous data + linked views" puts an Autark map beside Vega-Lite charts that respond to each other (see Linked views). The example gallery linked below has a step-by-step walkthrough for each one.